
How to Find The Optimal Value of K in KNN
In K-Nearest Neighbors (KNN) algorithm one of the key decision that directly impacts performance of the model is choosing the optimal value of K. It represents number of nearest neighbors to be considered while classifying a data point. If K is too small or too large it can lead to overfitting or underfitting. In this article we will explore methods for determining best value of K for KNN and how it affects model performance.
Understanding the Impact of K
- Small K values: This can make model highly sensitive to noise and might overfit the training data. It will focus on nearest neighbors which may not always represent global distribution.
- Large K values: This can make model smooth out decision boundary leading to underfitting. The classifier becomes less sensitive to local patterns and more influenced by the overall data distribution.
It is recommended to choose value of k as odd to avoid situations of tie in classifying tasks.
-660.png) K-Nearest Neighbors
K-Nearest Neighbors
Selecting optimal value of k Manually
Here we see how we can choose a optimal value of k manually.
- Define a Range: Set a range for k like 1 to 20.
- Data Split: Segment your dataset into training and testing sets for testing model generalization.
- Model Training: We train our model based using a value of k from above range
- Choose Metric: Choose a performance metric like accuracy, precision or recall.
- Evaluate Performance: Compute performance metrics for different value of k.
- Select Optimal value of k: Choose the k value that balances accuracy and simplicity.
- Test on New Data:-Validate the chosen k value on a test set to see its performance on new, unseen data.
 KNN Algorithm
By following these steps we can efficiently find best value of k for our KNN model that well aligns with our dataset's characteristics and machine learning objectives.
We can also use Cross validation in this for that please refer to this article: Cross Validation in Machine Learning
Choosing its value manually is very hectic and may not give the best value so we have various techniques too find its optimal value.
Techniques to Find Optimal Value of k
1. Elbow Method
Similar to techniques used in clustering elbow method can also be used here to find the optimal value of K by plotting the performance of KNN against different K values. The elbow point on the plot represents the optimal K where the error rate starts to flatten out.
Steps:
- Plot error rates for various K values.
- Look for the K value where the performance improves drastically before leveling off.
The "elbow structure" signifies the balance between bias and variance.
Python Implementation:
Here we are using iris dataset available in scikit learn library.
import numpy as np
import matplotlib.pyplot as plt
from sklearn.model_selection import train_test_split
from sklearn.neighbors import KNeighborsClassifier
from sklearn.datasets import load_iris
from sklearn.metrics import accuracy_score
data = load_iris()
X = data.data
y = data.target
X_train, X_test, y_train, y_test = train_test_split(X, y, test_size=0.3, random_state=42)
k_values = range(1, 21)
error_rates = []
for k in k_values:
knn = KNeighborsClassifier(n_neighbors=k)
knn.fit(X_train, y_train)
y_pred = knn.predict(X_test)
error_rate = 1 - accuracy_score(y_test, y_pred)
error_rates.append(error_rate)
plt.figure(figsize=(8, 6))
plt.plot(k_values, error_rates, marker='o')
plt.xlabel('K Value')
plt.ylabel('Error Rate')
plt.title('Elbow Method for Finding Optimal K')
plt.axvline(x=3, linestyle='--', color='red', label="Optimal K (Elbow Point)")
plt.legend()
plt.show()
- error_rate: is used to evaluate error to find the elbow structure
Output:
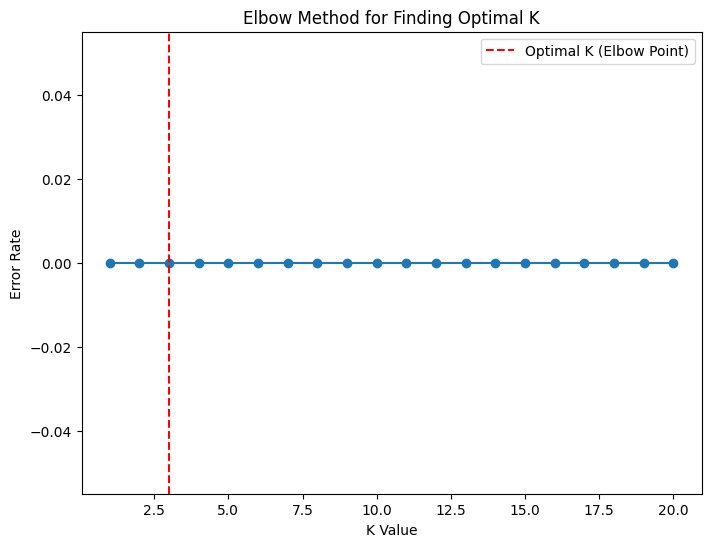
Here we got optimal value of k as 3.
2. Bias-Variance Tradeoff
Understanding the bias-variance tradeoff is used when selecting the optimal K.
- High Bias (Underfitting): If K is too large the model might generalize too much resulting in high bias like K=50.
- High Variance (Overfitting): If K is too small the model becomes too sensitive to noise causing high variance like K=1.
By trying different values of K we aim to balance bias and variance for choosing the K that minimizes both.
3. Grid Search with Cross-Validation
Grid search automates the process of testing multiple K values along with other hyperparameters. We can use GridSearchCV from scikit-learn libraries to search through different combinations of K values and evaluate the performance using cross-validation.
Steps:
- Define a range of K values (e.g 1 to 20).
- Use GridSearchCV to search over the specified range of K values.
- The grid search evaluates the performance for each K and selects the optimal value.
from sklearn.model_selection import GridSearchCV
from sklearn.neighbors import KNeighborsClassifier
knn = KNeighborsClassifier()
param_grid = {'n_neighbors': range(1, 21)}
grid_search = GridSearchCV(knn, param_grid, cv=5)
grid_search.fit(X_train, y_train)
optimal_k = grid_search.best_params_['n_neighbors']
print(f"The optimal K value is: {optimal_k}")
Output:
The optimal K value is: 5
4. Leave-P-Out Cross-Validation (LP-CV)
In Leave-P-Out Cross-Validation you leave out P data points at a time rather than just one. This is similar to LOO-CV but can be more efficient in some cases with larger datasets. This technique is more computationally expensive but can be helpful in finding an optimal K when cross-validation results are unstable.
from sklearn.model_selection import LeaveOneOut
from sklearn.neighbors import KNeighborsClassifier
from sklearn.metrics import accuracy_score
loo = LeaveOneOut()
k_values = range(1, 21)
mean_accuracies = []
for k in k_values:
knn = KNeighborsClassifier(n_neighbors=k)
accuracies = []
for train_index, test_index in loo.split(X):
X_train, X_test = X[train_index], X[test_index]
y_train, y_test = y[train_index], y[test_index]
knn.fit(X_train, y_train)
y_pred = knn.predict(X_test)
accuracies.append(accuracy_score(y_test, y_pred))
mean_accuracies.append(np.mean(accuracies))
plt.figure(figsize=(8, 6))
plt.plot(k_values, mean_accuracies, marker='o')
plt.xlabel('K Value')
plt.ylabel('Mean Accuracy')
plt.title('Leave-One-Out Cross-Validation for KNN')
plt.show()
Output:
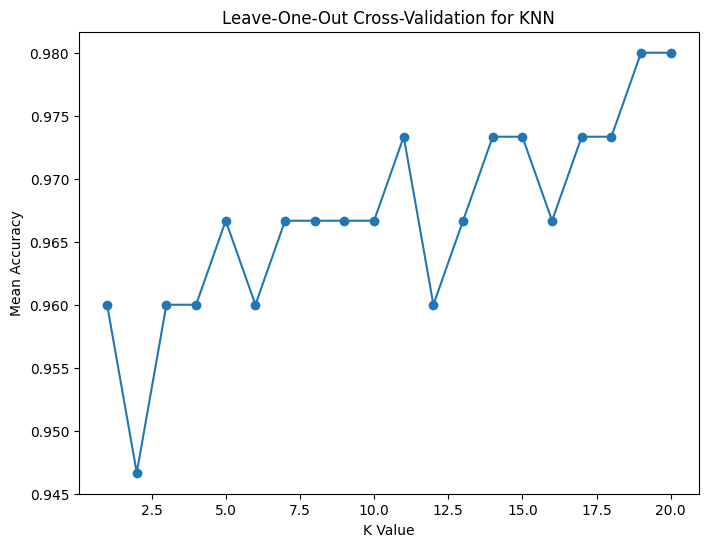
Initially the accuracy drops for small K values due to overfitting. As K increases the
How to determine optimal K in k-means:
- Elbow method — plot WCSS (within-cluster sum of squared distances) vs K; choose K at the “elbow” where reduction in WCSS slows.
- Silhouette score — measures how similar a point is to its own cluster vs nearest other cluster; average silhouette near +1 is good. Pick K maximizing silhouette.
- Gap statistic — compare WCSS to that expected under random reference distribution; choose K with largest gap.
- Cross-validation or domain knowledge — sometimes practical considerations (interpretability, business needs) set K.
accuracy improves and stabilizes with some fluctuations. The optimal K is likely around K=16 or K=17 where the accuracy is consistently high indicating the best balance between overfitting and underfitting.